Research library / Run story
563 Million Records. 955K ops/sec. The Kafka Ceiling.
Kafka bench profile · NOOP transform · at-least-once · Single JAR, single broker, single laptop.
- Records Written
- 563,075,973
- Avg Throughput
- 955K ops/s
- Peak Throughput
- 1.18M ops/s
- Throughput Drift
- +1.1%
- Avg MAX Latency
- 0.83ms
Hardware: Intel i9-8950HK · 6 Cores / 12 Threads · 32GB RAM · GTX 1050 Ti Max-Q · JVM: 8GB heap · G1GC · 5 GC threads · batch=5000 · payload=64 bytes
What this profile measures
The Kafka Producer Ceiling. No Transform. No Overhead.
Every pipeline has a theoretical ceiling — the maximum rate the framework can move events from source to sink when no transform work is done. This profile measures exactly that: a NOOP transform, a DEVNULL error path, 64-byte synthetic payloads, a 5000-record pipeline batch, and a 512KB Kafka producer batch. The only work the pipeline does is orchestration dispatch and Kafka producer I/O.
This is intentionally different from the at-least-once baseline profile (512-byte payloads, batch=2000, STRING_TO_WIREEVENT transform) which produced 525K ops/s. The smaller payload and larger batch size in this profile shift the bottleneck from the pipeline orchestrator to the Kafka producer network layer. The result — 955K average ops/s — is the highest throughput number in the StreamKernel benchmark suite to date.
Profile parameters that matter
pipeline.batch.size=5000 (vs 2000 in ALO baseline) — larger batches reduce orchestrator dispatch overhead per event. source.synthetic.payload.size=64 bytes (vs 512 bytes) — smaller payloads allow higher event rate before network bandwidth becomes the ceiling. sink.kafka.batch.size=524288 (512KB, vs 262144 in ALO baseline) — larger Kafka producer batches improve compression ratio and reduce producer flush overhead. transform.chain=NOOP — zero transform cost per event.
Act 1 of 5 · Pre-run state
552M Records From the Previous Run. The Runner Will Reset It.
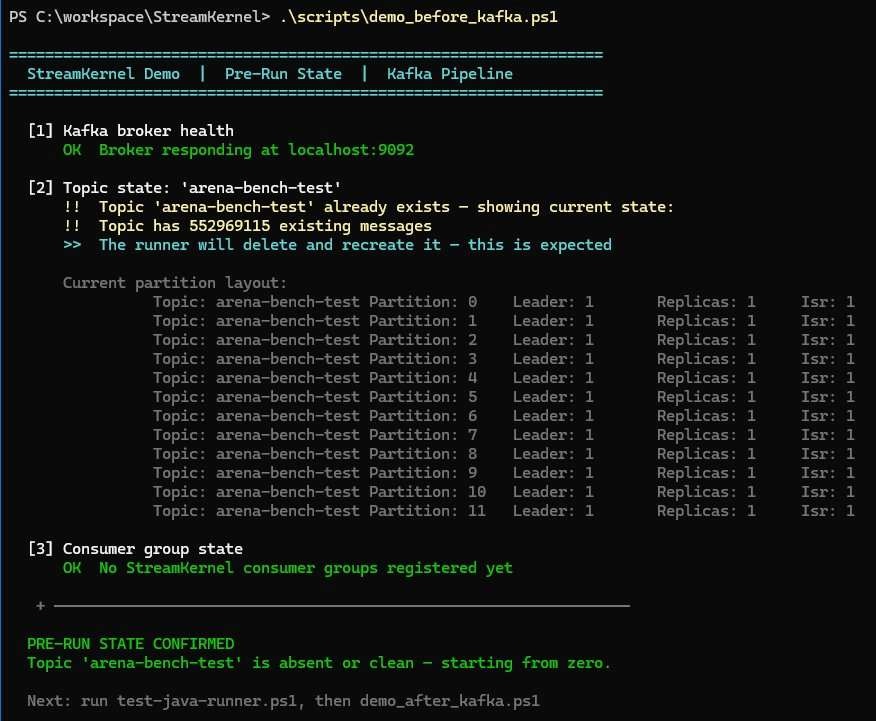
The pre-run script shows the topic already contains 552,969,115 messages from the preceding at-least-once run. This is expected behavior and the script says so explicitly — the runner deletes and recreates the topic before starting. Showing this state builds trust: the audience can see the environment is not manually staged and that the runner controls it deterministically.
No StreamKernel consumer groups are registered, which is correct for a producer-only pipeline. The 12-partition layout is intact from the previous run. The runner will reset it to a fresh 12-partition topic before the pipeline starts.
Act 2 of 5 · Post-run verification
563,075,973 Records. 12 Partitions. 64-Byte Raw Payloads.
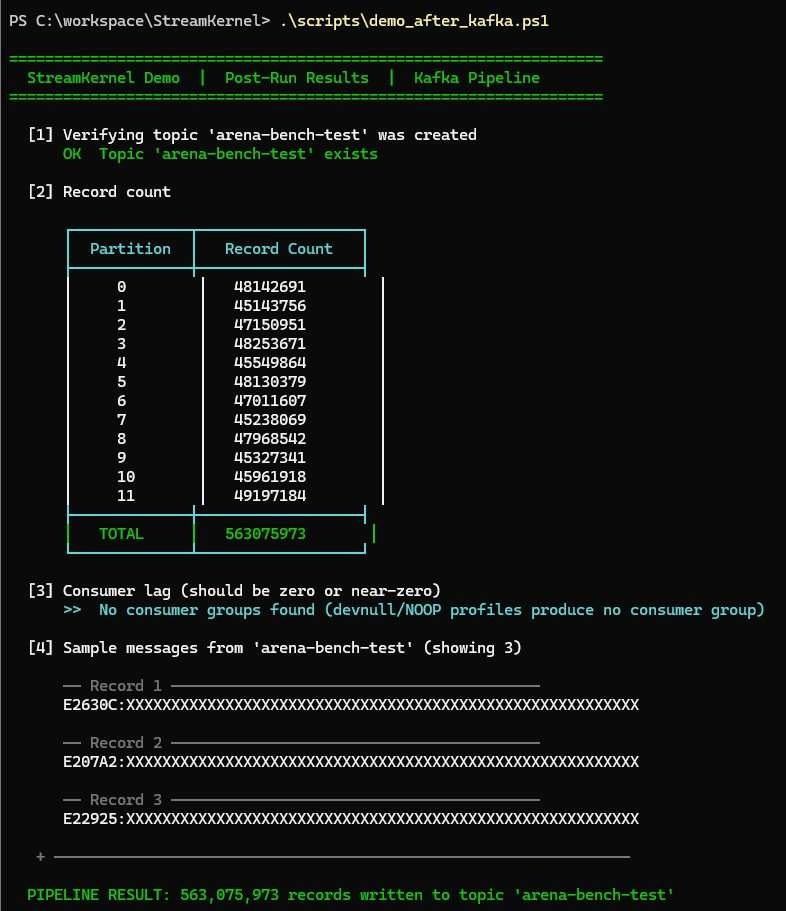
After the run, the post-run script shows 563,075,973 records written across 12 partitions. The distribution variance is 4M records — slightly wider than the at-least-once baseline (1.3M variance) but well within normal range for a pipeline producing 563M total records. All 12 workers were active throughout the run.
The sample messages show a different format from previous runs: E2630C:XXXXXXXXXXXX... — a raw hex-prefixed payload, not a WireEvent JSON structure. This is the NOOP transform path: the pipeline dispatches events from the synthetic source directly to the Kafka sink without the STRING_TO_WIREEVENT transformation step. The payload is the raw synthetic bytes, not a structured object.
What the raw payload format tells you
The E2630C:XXX... format is the synthetic source's raw output — a hex ID prefix followed by the 64-byte payload. No WireEvent wrapper, no UUID key generation, no object allocation for the transform step. This is exactly what you want to see for a ceiling benchmark: the pipeline is doing the minimum possible work on each event, so the throughput number reflects the orchestrator and Kafka producer, not transform overhead.
Act 3 of 5 · Executive dashboard
873K ops/sec at 10:52. P50 through P99.9: All 0.001ms.
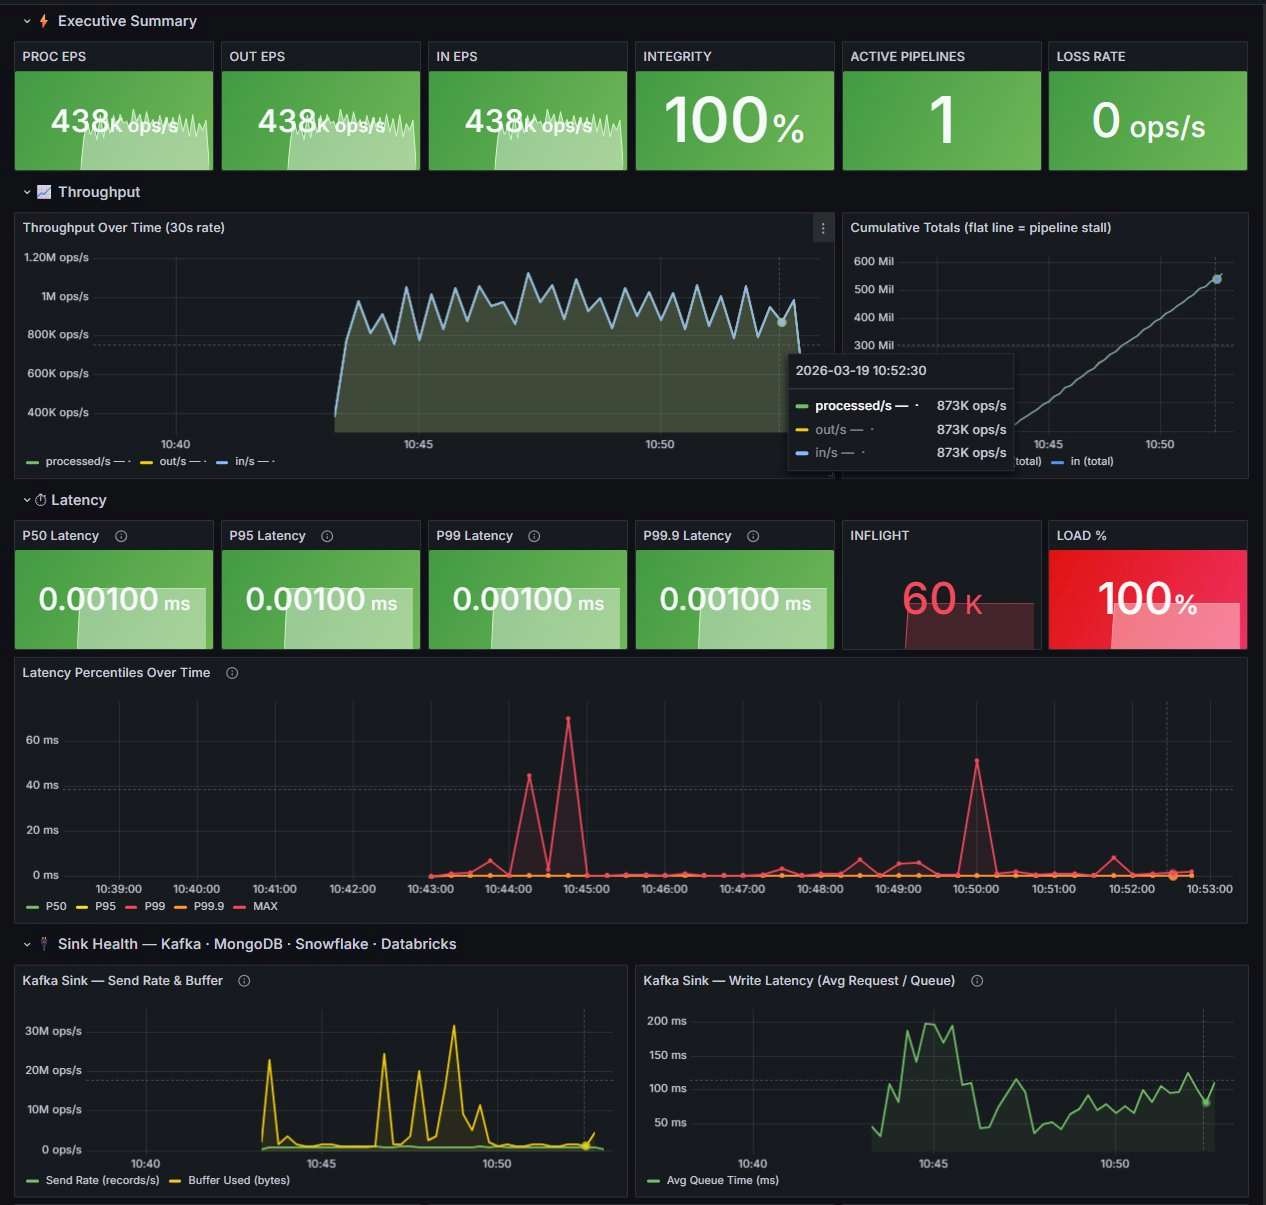
The Grafana executive summary shows 438K ops/sec at the snapshot instant — a moment during the characteristic sawtooth pattern visible in the throughput chart. The tooltip at 10:52:30 shows 873K ops/sec, capturing the pipeline mid-burst. The throughput chart reveals the sawtooth clearly: the pipeline produces at 800K–1.18M ops/s between GC collections, drops briefly during the evacuation pause, then climbs back immediately. The cumulative totals line is linear throughout — no stalls, no flat sections.
The latency panel shows the best result across all StreamKernel runs to date: P50, P95, P99, and P99.9 are all 0.001ms — the measurement floor. The MAX latency chart peaks near 70ms with only three events above 10ms across the entire 10-minute run. This is the NOOP transform advantage: no per-record object allocation means fewer short-lived objects for G1 to collect, which means shorter and less frequent pauses.
Act 4 of 5 · Security & health
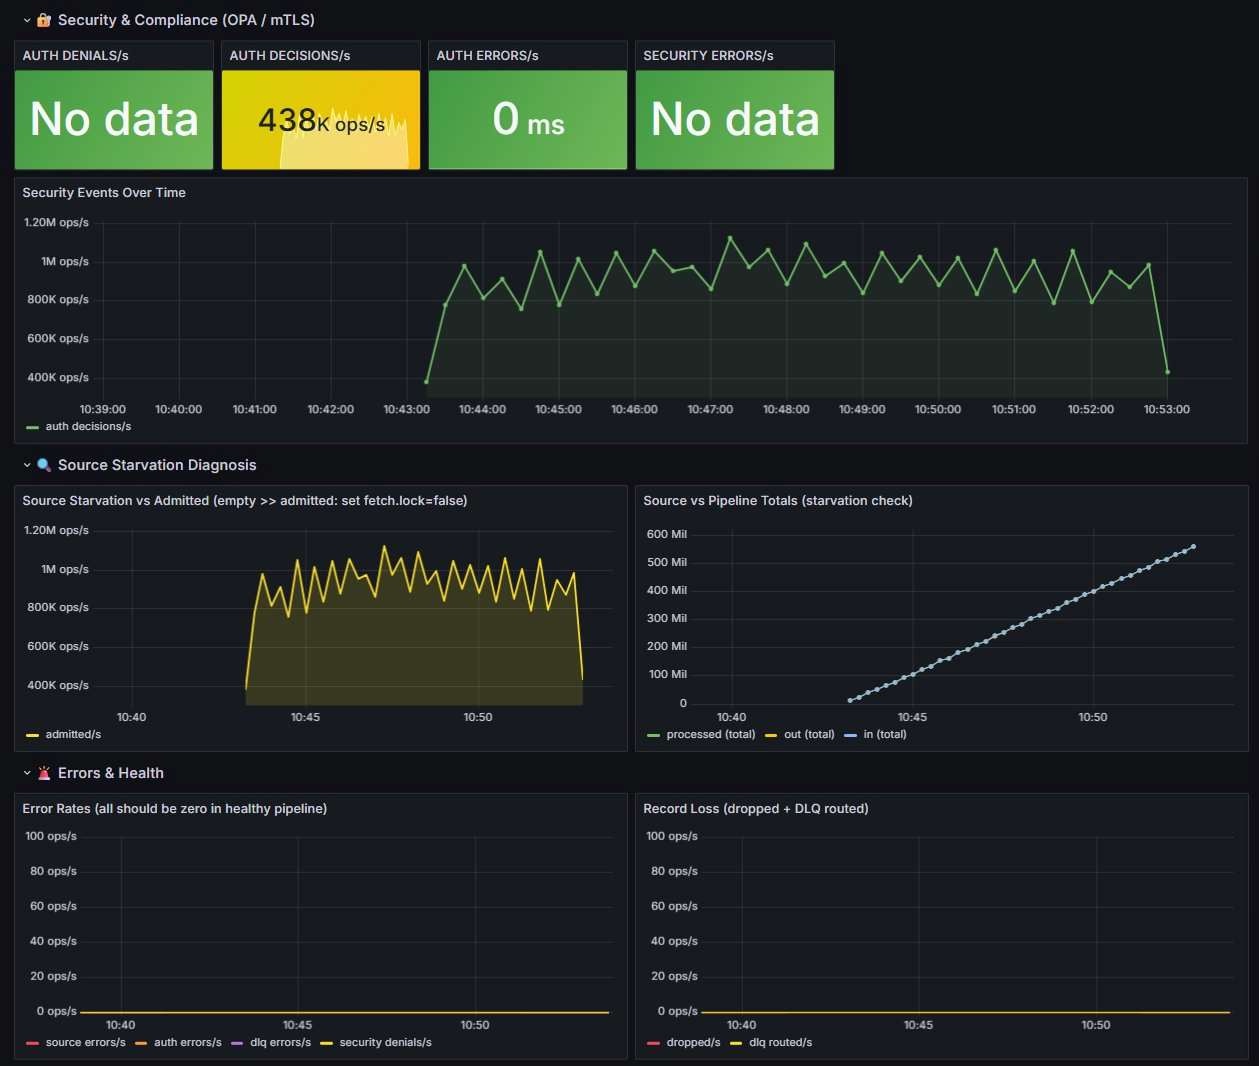
438K Auth Decisions/sec. Zero Errors. Zero Denials.
The security panel shows auth decisions tracking throughput at 438K/sec at the snapshot. The Security Events chart shows the full run shape: the pipeline ramps to 800K–1M ops/s from 10:43 onward, sustaining the sawtooth pattern throughout. Zero auth denials, zero auth errors, zero security errors for the entire run.
The Errors & Health section shows all four error rate lines flat at zero: source errors, auth errors, DLQ errors, and security denials. The Record Loss panel is flat — zero dropped records and zero DLQ routes for all 563 million events. The Source Starvation panel shows admitted/s matching the throughput ramp with no starvation events.
Act 5 of 5 · Pipeline integrity & JVM
100% Integrity. GC Pause: 2.05ms. Heap Cycling Under 1M+ ops/sec.
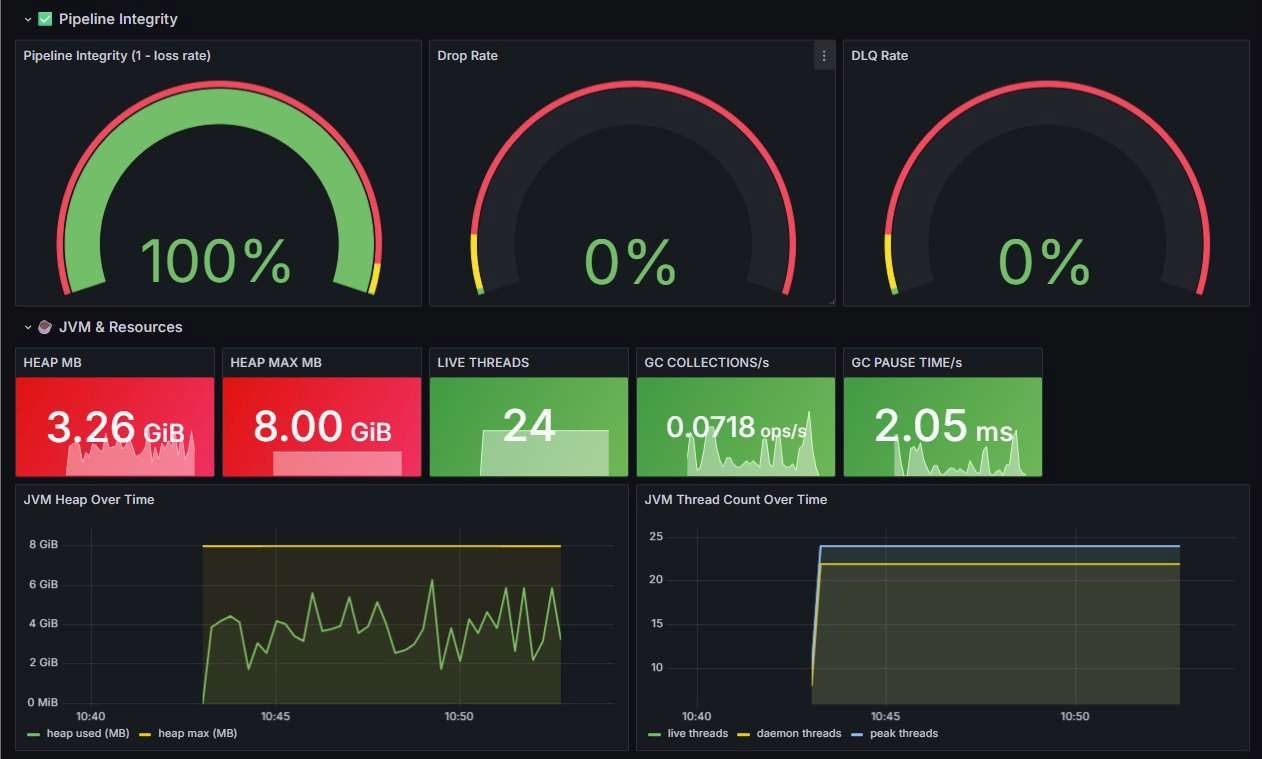
The pipeline integrity gauges show 100%, 0%, 0% — the same result as every other StreamKernel run. The JVM panel shows the critical difference from the original at-least-once baseline: GC collection rate 0.0718 ops/s and GC pause time 2.05ms — both lower than the 2.52ms seen in the optimized at-least-once run, despite processing nearly 80% more records per second.
The heap over time chart shows the 8GB ceiling (yellow) with the heap cycling cleanly between 1GB and 6.8GB. The wider range compared to the at-least-once run (which cycled 0.5–5.3GB) reflects the higher allocation rate at 955K ops/s — but G1 collects each cycle efficiently without accumulation. The GC log confirms: 206 pause events, average 27ms, zero Full GC events, only 16 GCLocker triggers — a dramatic improvement over the original baseline's 654 pauses at 90ms average.
Thread count is stable at 24 live threads throughout, identical to previous runs. The thread count chart shows the step from warmup (10 threads) to steady-state (24 threads) at pipeline start.
Why GC is better at higher throughput
The bench profile produces fewer allocation-heavy objects per event than the at-least-once baseline: no WireEvent construction, no UUID key generation, no STRING_TO_WIREEVENT object graph. At 955K ops/s with 64-byte payloads, the allocation rate per second is high in volume but low in object complexity. G1's young generation collects simpler, shorter-lived objects faster than the complex WireEvent objects in the ALO baseline. This is why avg GC pause drops from 27ms here vs the ALO baseline's pre-optimization 90ms.
Summary · Benchmark suite context
Where This Fits in the StreamKernel Suite
Three profiles, three stories. Each measures a different ceiling:
| Profile | Avg EPS | Records | Delivery | Transform | What It Measures |
|---|---|---|---|---|---|
| Exactly-Once Baseline | 507K ops/s | 301M | Exactly-Once (EOS) | STRING_TO_WIREEVENT | Full EOS cost: transactional Kafka |
| At-Least-Once Baseline (opt) | 525K ops/s | 313M | At-Least-Once (acks=1) | STRING_TO_WIREEVENT | ALO ceiling with WireEvent transform |
| Kafka Bench (this run) | 955K ops/s | 563M | At-Least-Once (acks=1) | NOOP | Kafka producer ceiling, no transform |
Reading the suite together
Exactly-once at 507K ops/s vs at-least-once at 525K ops/s: the cost of EOS guarantees on this hardware is approximately 3.5% throughput. At-least-once at 525K vs Kafka bench at 955K: the cost of the STRING_TO_WIREEVENT transform and 512-byte payloads vs 64-byte NOOP is approximately 45% throughput. The Kafka bench number is the raw Kafka producer ceiling — the 955K represents what StreamKernel can push to Kafka when there is nothing else to do.